Saturday, December 30, 2006

Activated Carbon Treatment

This post is a continuation of the series of articles aimed at providing some degree of in-depth understanding of various water treatment processes that may be considered for recycling applications. The topic this time is activated carbon treatment. Consistent with previous such posts, I have provided a couple of references at the end for those who may be inspired to research the topic further (or check that I’m not making it up as I go along!).

Activated carbon is a form of carbon usually derived from charcoal. The term ‘activated’ refers to the way the carbon has been prepared to enhance its ability to physically ‘adsorb’ chemicals to its surface. Adsorption is the accumulation of a dissolved chemical (solute) onto a solid surface.

Activated carbon

An important property of activated carbon is its extremely high surface area. One gram (about a teaspoon full) of activated carbon can have a surface area of 400-2000 square metres. By comparison, a tennis court is about 260 square metres. A microscopic view of activated carbon reveals a complex web structure intermingled with trapped smaller particles. There are many nooks and crannies, which provide excellent conditions for adsorption of suitable chemicals.

Activated carbon is widely used in drinking water treatment for the removal of certain chemicals. The chemicals for which activated carbon is most effective are those which are relatively non-polar in their chemical structure.

A term commonly applied to describe chemicals is their degree of ‘lipophilicity’. Lipophilic chemicals are generally non-polar chemicals that are accumulated in lipids (fats and oils). The same properties that tend to make chemicals accumulate in lipids also tend to make them well adsorbed to activated carbon. Therefore, lipophilic chemicals are chemicals that are generally well removed from water by activated carbon treatment.

The most common applications of activated carbon for water treatment are known as granular activated carbon (GAC) and powdered activated carbon (PAC). These terms simply refer to the physical form (particle size) in which the activated carbon is applied. Smaller particle sizes (PAC) tend to have higher surface areas while large particle sizes (GAC) tend to be more easily separated from the water subsequent to treatment. PAC is often used by direct addition to water with mixing and then separated by gravity and/or filtration. Alternatively, GAC is more commonly used as filtration media with the water being percolated through it.

PAC and GAC are effective for the removal of a diverse range of lipophilic organic compounds as well as well as some relatively lipophilic inorganic compounds such as nitrogen, sulphides and heavy metals. However, more polar compounds are relatively poorly removed by activated carbon adsorption.

The parameter most commonly used to describe how well a substance can be adsorbed to activated carbon is known as the Freundlich capacity factor. The Freundlich capacity factor is determined experimentally by testing various ratios of chemical concentration and activated carbon surface area in otherwise clean waters under controlled conditions. A high Freundlich capacity factor indicates that the chemical is very effectively adsorbed, while a low Freundlich capacity factor indicates that the chemical is poorly adsorbed.

The range of Freundlich capacity factors for potential water contaminants is extremely wide. For example, polychlorinated biphenyls have Freundlich capacity factors greater than 10,000 while N-nitrosodimethylamine (NDMA) has a Freundlich capacity factor of around 0.0001. Furthermore, specific mixtures of compounds in a raw water source will affect the adsorptive capacity for each compound.

In 2005, a group of researchers from Arizona State University, Northwestern University (Illinois) and Southern Nevada Water Authority published a paper investigating the fate of endocrine-disruptors, pharmaceuticals, and personal care products during simulated water treatment processes [1]. For this research, they collected raw drinking water supplies and artificially spiked in high concentrations of 62 different chemicals. These waters were then treated by a number of laboratory-scale water treatment processes including PAC. Addition of 5 milligrams per litre of PAC with a 4-hour contact time removed different compounds by between 10% to greater than 98%. Higher PAC dosages improved the removal of most compounds. This study confirmed that the removal effectiveness for specific chemicals could be reasonably well predicted based on their lipophilicity.

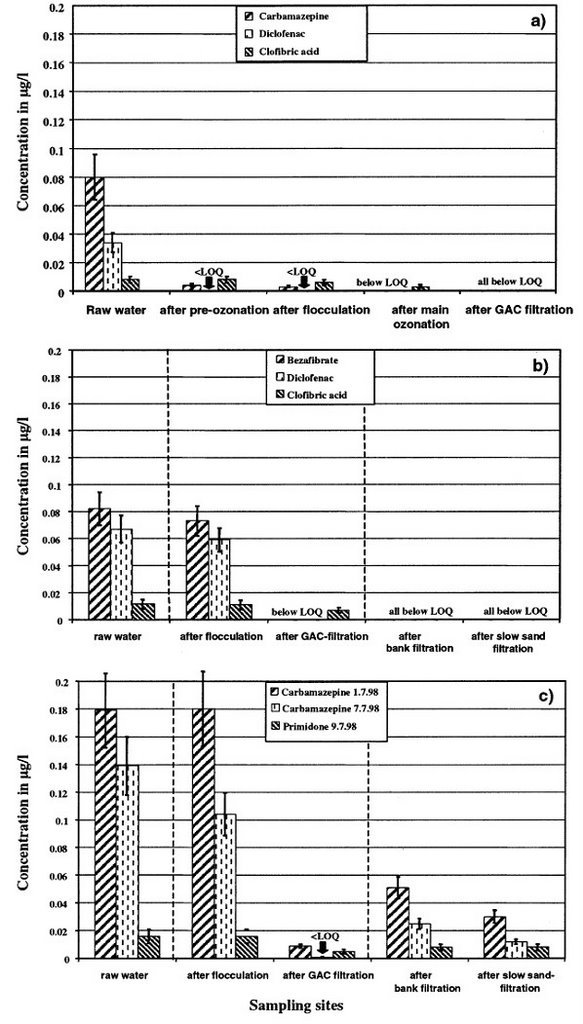
GAC has also been shown to be effective for the removal for some important organic chemical contaminants in water. For example, a group of researchers in Germany has investigated the removal of selected pharmaceuticals during a range of drinking water treatment processes [2]. This study revealed GAC filtration to be an effective method for removing most of the studied compounds. The image below shows the relative concentrations of some of these compounds that were actually measured in raw drinking water sources (that is, they were not artificially spiked in). It can be seen that GAC treatment, in combination with other conventional treatment processes, significantly removed most of the pharmaceuticals. In a number of cases, remaining concentrations were reported to be below the limit of quantitation (LOQ). This simply means that the concentrations were too low to be reliably measured.

Click to Enlarge

These studies are consistent with the conventional understanding and application of activated carbon treatment processes. Like all water treatment processes, activated carbon is not a silver bullet and is not intended to be so. However, used as a component of a carefully selected suite of treatment processes, activated carbon has an important role to play in water purification.

As always, I'd be grateful for your comments...


[1] Westerhoff, P., Yoon, Y., Snyder, S. and Wert, E. (2005) Fate of endocrine-disruptor, pharmaceutical, and personal care product chemicals during simulated drinking water treatment processes. Journal: Environmental Science and Technology, Volume: 39, Issue: 17, Pages: 6649-6663.

[2] Ternes, T. A., Meisenheimer, M., McDowell, D., Sacher, F., Brauch, H.-J., Haist-Gulde, B., Preuss, G., Wilme, U. and Zullei-Seibert, N. (2002) Removal of pharmaceuticals during drinking water treatment. Journal: Environmental Science and Technology, Volume: 36, Issue: 17, Pages: 3855-3863.

Since I stole the nice activated carbon image from another website, I suppose it would be polite to point you to their site as an example of a company that supplies GAC and PAC for a wide range of applications...not just drinking water treatment.

Tuesday, December 19, 2006

LA Health Effects Study 1962-1981

I’ve been crawling around some dark and dusty corners of the UNSW library, tracking down some old reports on health effects studies of recycled water. Brushing aside the cobwebs, I found a paper published in 1984 by Dr. Ralph Frerichs from the UCLA School of Public Health (see bottom of this post for the full reference).

Dr Frerichs’ study was undertaken in eastern Los Angeles County of California, which had been intentionally recharging underground drinking-water supplies with treated effluent since 1962. Although water extracted from the recharged system consistently met current drinking water standards, there was concern that potentially hazardous substances may have been either overlooked or not considered due to low concentrations.

The proportion of recycled water in drinking water supplies was (and is) variable in different parts of LA. In order to monitor the health of the population potentially exposed to unknown water contaminants, four separate study areas were identified. In two of the areas (the northwest and central control areas) drinking water did not contain any recycled water. In the third area (low recycled water area) households received less than 5 per cent recycled water. In the fourth area (high recycled water area) households received 5 per cent or more recycled water. During the course of the study (in the mid-1970s), the proportion of recycled water increased to nearly 16 per cent in the high recycled water area and 6 per cent in the low recycled water area. At the time, around 1.2 million people resided with the combined four study areas.

A study that examines the health statistics of a population in order to try to identify causes of illness is called an epidemiologic study. Such a study was undertaken in the four LA areas, starting with data from 1969 and going through until 1980. This part of the study relied on census health data and a local cancer surveillance program which was established in 1972.

In addition, a household survey was conducted in 1981 among approximately 2500 women living in the central control area and the high recycled water area. This survey was added to pick up information about adverse reproductive outcomes such as miscarriages; general indicators of illness such as bed-ridden days; possible confounding effects such as alcohol consumption and cigarette smoking; patterns of water consumption; and general morbidity (illness).

The health and disease outcomes included in the monitoring program are shown below.

Existing Vital and Health Data

Mortality (deaths)
1. Death due to all causes
2. Diseases of the heart
3. All cancers (malignant neoplasms)
4. Cancer of the stomach
5. Cancer of the colon
6. Cancer of the rectum
7. Cancer of the bladder
8. Death due to all other causes

Morbidity (illnesses)
9. All potential waterborne diseases
10. Hepatitis A
11. Shigellosis

Birth Outcomes
12. Low weight birth (less than 2,500 gms)
13. Very low weight birth (less than 1,500 gms)
14. Neonatal deaths
15. Infant deaths
16. Congenital malformations at birth

Cancer Surveillance System Data

Incident Cases
17. Cancer of the stomach
18. Cancer of the colon
19. Cancer of the rectum
20. Cancer of the bladder

Household Survey of Women

Adverse Reproductive or Gynecological Outcomes
21. Infertility
22. Menstrual problems
23. Congenital defects
24. Spontaneous abortions (stillbirth)

Functional Impairment
25. Restricted activity days
26. Bed-disability days
27. Hospital-bed days

The relative incidences of these health effects were statistically analysed in the four study areas. The effects of several confounding variables were controlled for where appropriate, including age, sex, race, age of mother and birth weight.

If the consumption of recycled water contributed to excess disease or death, we would expect the relative incidences to be greatest in the high recycled water area, intermediate in the low recycled water area, and similar to the remainder of LA County in the two control areas. Furthermore, we would expect this dose-response relationship to be more amplified in the later years of the study since the concentration of recycled water gradually increased.

Some minor statistical differences were observed between the study areas, including deaths due to all cancers, cases of shigellosis, very low births, and neonatal mortality. However, for none of these factors, were the differences in a direction that would support the hypothesis that increased concentrations of recycled water contributed to excess disease.

In the household survey, no significant differences were observed between the two groups of women in restricted-activity days, bed-disability days, hospital bed-days, or recent contacts with a health professional. Nor were differences observed in the rate of spontaneous abortions, congenital malformations, menstrual problems, or problems of fertility.

The authors of the study summarised their conclusions as follows:

While we can never ensure the complete safety, it is reasonable to assume that the disease risk attributed to the consumption of reclaimed water has been minimal for persons residing in the high and low recycled water areas in eastern Los Angeles County. This does not mean that there is no risk. Nor does it mean that there will be no risk in the future. Rather, available epidemiologic evidence provides no indication that the reuse of water has had a noticeable harmful effect. If findings in the on-going water characterization study are also negative, the combined investigations should provide strong evidence to both the public and to the responsible governmental officials as to the relative safety of water reuse.

All studies of this type have their limitations (people moving into and out of areas, unidentified confounding factors, limited sensitivity to detect extremely low risks, etc). I know that 1984 -when the paper was published- was a long time ago, but I still think this is a nice piece of epidemiology.

What do you reckon?


Source: R.R. Frerichs “Epidemiologic Monitoring of Possible Health Reactions of Wastewater Reuse”. Journal: The Science of the Total Environment. Vol: 32, Year: 1984, Pages: 353-363.

Wednesday, December 06, 2006

A more appropriate argument

An argument is brewing over recycled water in Texas, USA.

The situation is a bit like Toowoomba in some ways: An inland city (in this case Dallas) has witnessed water resources being depleted over the last few years, while populations continue to rise. The city sits towards the top of an important river system (The Trinity River) and currently discharges treated effluent into that river. A plan has been developed to reduce that discharge and recycle the water for Dallas to use again.

There is growing disagreement about whether it is acceptable to recycle the water in Dallas or if it should be left to flow downstream as it currently does. However, this is where the comparisons with Toowoomba end. You see, downstream towns and cities on the Trinity River consider the “unplanned” recycled water that they receive to be a valuable resource. While some Australians refer to such schemes as “bad practice” [which, I notice has recently evolved to “bad science”], Texans are prepared to fight for it.

The city of Dallas operates two sewage treatment plants, -Central WWTP and South Side WWTP. Since 2003, Dallas Water Utilities has been developing a plan to upgrade the effluents from these plants and convey these back to city’s main storage reservoirs, Lewisville Lake and Lake Ray Hubbard.

The figure below was presented by Dallas Water Utilities personnel at a conference that I attended in 2005. It is not currently a formal plan of the agency, but shows in concept the types of ideas that are under consideration. Click for a larger image.


Dallas Assistant City Manager, Ramon Miguez, says that in the long term Dallas intends to supplement its supply with 60 million gallons of recycled water per day. However, there is now concern that newly developing legislation will prevent the city from keeping the water for its own use. Under this expected new legislation, the State of Texas could require the city to apply for a special permit to recycle the water instead of allowing it to flow downstream. In other words, the State could overrule any plans from Dallas that may reduce the volume of recycled water available for downstream communities.

The Trinity River supplies water to a number of very dry cities as it makes its way down to the Gulf of Mexico. Towards the bottom, the State’s largest city, Houston imports part of its supplies from the river to supplement its own diminishing groundwater supplies.

A lobbyist hired to represent Dallas’ interests was quoted this week as saying [be sure to read this with a Texan accent!] “if a powerful lobby of parched cities across Texas demands that Dallas send more water down the river, North Texas could see decades of deliberate planning flushed away”.

State Representative, Robert Puente, says the legislation will be based on science, not politics [-yes, I know its an unorthodox idea, but I can’t help thinking that it might have some merit]. He said “we need to make sure there’s enough water in our lakes and rivers to get all the way down to the Gulf of Mexico”. That seems like a very fair argument and I am certainly not suggesting that it is not an extremely important consideration.

There’s an argument brewing, to be sure. However, its strangely refreshing to see cities arguing for their right to practice (planned or “unplanned”) indirect potable water recycling. A truly bad practice –or bad science- is the failure to recognise a valuable resource when we see it. Perhaps we’ll work it out one day...

Friday, December 01, 2006

Has Toowoomba already voted NO?

As most readers would be aware, South East Queensland will vote in March on the question of whether to supplement drinking water sources with recycled water. Or as Premier Beattie put it today:

"This (question) basically is: 'Are you or are you not in favour of drinking purified recycled water to a standard that's accepted by health officials around the world'"

Nineteen Shires are to vote, including Toowoomba since that city is considering the possibility of extracting future supplies from Wivenhoe Dam. But ‘hold on’, you say! Didn’t Toowoomba vote no to the same question only five months ago?

I don’t believe they did. I watched that debate fairly closely and was assured by many of the ‘No’ campaigners that there were specific issues associated with the Toowoomba proposal that motivated them to vote no. Here’s how Cr Snow Manners put it three days after the poll:

Posted by Snow Manners of Toowoomba on Tue 01 Aug 06 at 03:58pm
"The Toowoomba debate was not about drinking recycled water. It was about a community considering it options, dam water, bore water, rainwater or sewage water. Sewage water was not the preferred option (apparently). The other options are now being more closely examined. People of Toowoomba also expressed concern that they were never given the opportunity to provide inputs to Council about their preferred options. Toowoomba has a very high proportion of tertiary educated people in the community by virtue of being a city of 100,000 people with a major University and a host of highly respected private schools serving western Queensland and also by virtue of having major corporate offices and government headquarters serving that huge region as well as being a centre for medical specialists serving the region. Other trade professionals and ordinary folk are not ill informed either. As a chosen retirement destination for farmers and graziers there are a lot of practical people in the city. Toowoomba’s choice was an educated and intelligent decision about options not a potable reuse debate."

Another “No” campaigner, “John C” left variations of the following two messages on numerous websites and blogs in the days following following the poll:

John C Says: August 20th, 2006 at 2:17 pm
"The problem with the recycled sewage plant proposed for Toowoomba is that it just would not work. It is not possible to produce 11,000 ML of recycled water from 8,000 ML of sewage. Toowoomba City Council also had nowhere for the RO waste stream to go. Acland Coal did not want it. Singapore pumps its RO waste stream into the sea. The plant could never have been built for $68 million - closer to $150-200 million would be more accurate when you take into account the hundreds of acres of evaporation ponds required which were not included in the budget. Regardless of your view on recycled water use, the No vote in Toowoomba was correct because the proposal was a dud".

John c says: July 31st, 2006 at 11:06 pm
"Many people in Toowoomba voted No, not because of any scare tactics, but because they had read the Council’s NWC funding application that Mayor Thorley tried to keep secret. This document showed the project as being fundamentally flawed. The Water Futures project was never a solution - where was the RO waste stream going to go. Where was Thorley going to hide it? Acland Coal didn’t want it. Without their involvement, the project’s cost doubled. How high would rates be then? You will be surprised at how quickly other water source options are now adopted for Toowoomba".

In addition to the issues raised by Cr Manners and “John C”, many people expressed concern about the loss of the water that currently flows from the Wetalla Sewage Treatment Plant, eventually into Oakey Creek and the Condamine River. This water is a recognised valuable resource to irrigators in the region and the loss of that water may have caused considerable hardship in these times of severe drought. Finally, there was widespread concern that the Toowoomba scheme would not solve current water shortages since it would not be online for a number of years.

Of course, all of these people will realise that any proposal involving recycled water from Luggage Point to Wivenhoe Dam will be quite a different proposal. Only those who voted according to some ideological opposition or support for (planned) potable recycling would suggest that their vote for Toowoomba is automatically transferable to the proposed South East Queensland Scheme.

People would not have raised the above issues if these did not significantly contribute to the decisions that they ultimately made.

Don’t you reckon?